One of the finance term which has suddenly gained lot of attention is 'Inverted Yield Curve'. So let's understand what does the Inverted Yield curve mean and what it indicates.
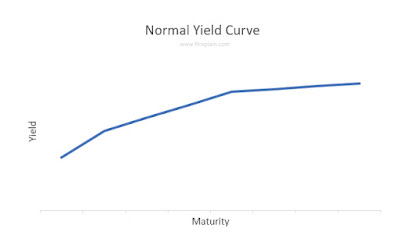
Yield curve is basically graphical representation drawn on expected interest (called yield) to be received on government bond (called as G-Security, Treasury bill, GILT etc) over different maturity period. Under normal situation, you get higher interest on Government bonds carrying longer maturity - which when plotted on graph give you positive slope for the yield curve. It looks something like below:
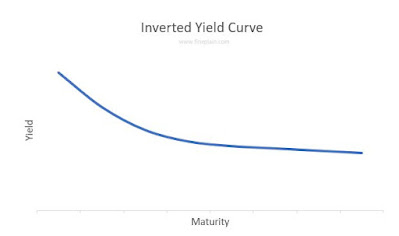
Historically, this yield curve has shown inverted or negative slope in the lead up to the recessionary environment or economic slowdown. This generally looks something like below:
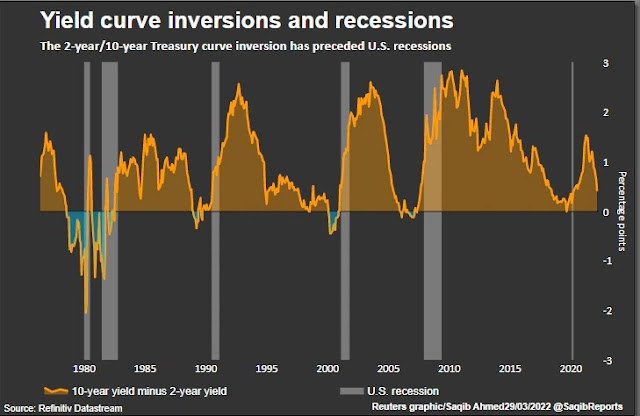
What to look out for? : Investors watch parts of the yield curve as recession indicators, primarily the spread between the yield on 2-year to 10-year (2/10) curve Treasury bills. Following graph by Reuters shows the historical recession and inverted yield curve happening very clearly.


0 Comments
Your comment is appreciated. I look forward for your views / feedback / suggestions.